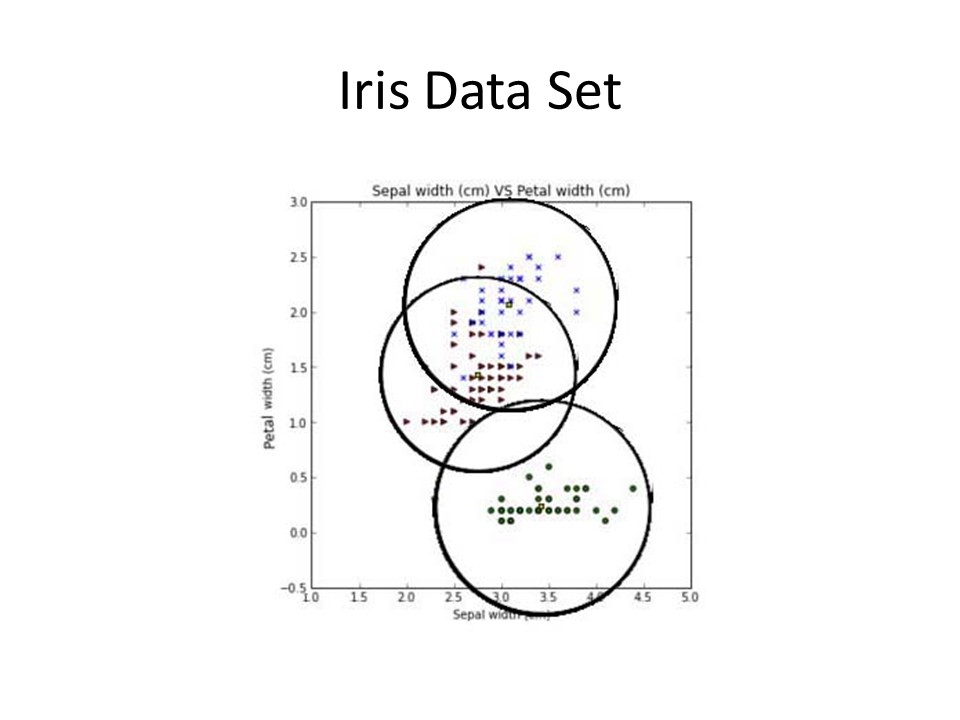
Here is a quick diagram to show how prediction works with this method. Pick a blank spot on the chart, the find the closest centroid to that point, and you find the classification that new point belongs in. Note how difficult it is to divide the blue (Iris Versicolor) and red (Iris Virginica) classes because they are quite mixed up together.
Return to my homepage