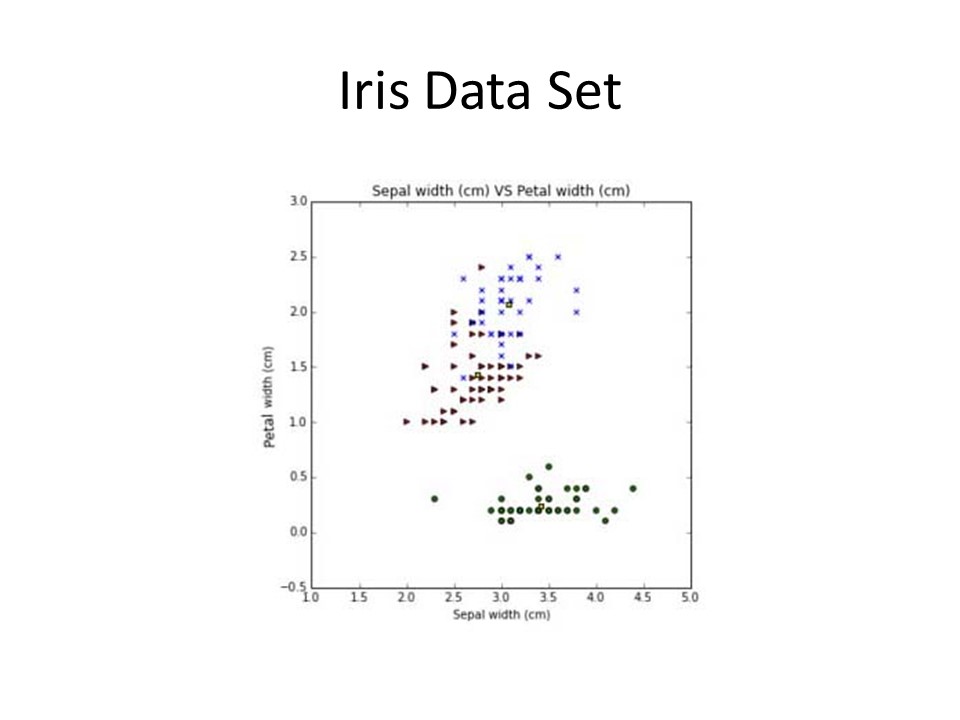
There are three different types of iris in the dataset, recorded by petal width and length, and sepal width and legnth (sepals are the green, non-colored parts of the flower that protect the petals before they bloom. I had to look up what sepals were!). Here, I have plotted the centroids for each region - that is, I calculated the "center of mass" for each category. The little yellow squares are the closest point on average to every data point in that category.
Return to my homepage